SAP Analytics Cloud (SAC): the value-driver tree
- SAP Analytics Cloud
- sap analytics cloud, value driver tree
- 2 min reading time

Dr. Eric Trumm

When evaluating key figures, it is often difficult to capture the complex relationships correctly, completely and quickly. An efficient solution for this is the so-called value factor tree (also called value driver tree), which is made available for planning models in the SAP Analytics Cloud (SAC).
Table of contents
1. decision making effectively supported
This tool for budgeting and the creation of forecasts based on various scenarios supports daily decision-making very effectively. For this purpose, the effects of individual influencing factors on the key figures are mapped - making even complex business value contribution calculations clearly presentable. As a result, the influence of each individual value driver on the various key figures of a company can be precisely analysed.
For the creation of a value factor tree, SAC offers a central entry point that makes the result quickly realisable. Centrally, the value factor tree is composed of four different node types:
- Data source
- Annual comparison
- Union
- Simple calculation
These make it possible to use the data from a model and - based on it - to carry out further calculations. The node "Data Source" provides the data from the model as a calculation basis for other nodes. By means of "Annual Comparison", the annual values for an account can be forecast using a base value and a growth rate factor. "Union" allows aggregation from one or more accounts, while "Simple Calculation" allows basic arithmetic calculations.
Once the value factor tree has been created, it can be added to a story to support the forecasting, budgeting and decision-making tasks.
Webinar
SAP Datasphere & SAP Analytics Cloud feature update in Q2/24
Date: 28.05.2024
Time: 08.30 - 09.15 a.m.
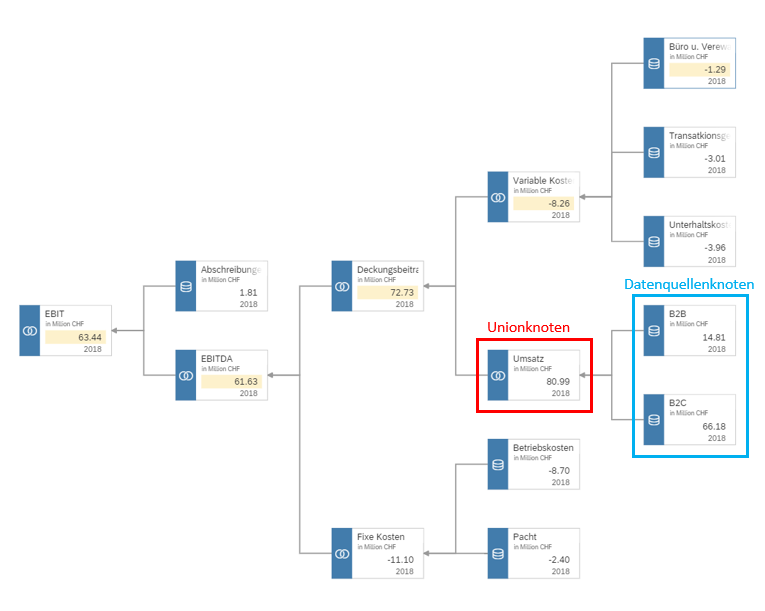
2. practical example: presentation of the EBIT calculation as a basis for forecasts
- The ready-built value factor tree in the following example aims to illustrate the calculation of EBIT and enable precise forecasts.
- Here, the turnover is a union node from the two data source nodes B2B and B2C.
- The total sales result in the Union node as the sum of the data source nodes.
- On this basis, forecasts can now be made quickly and easily.
- In parallel, it is also possible to change key figures in percentage or absolute terms:
- In the example, office and administrative costs are increased by 5%.
- This increases variable costs, which ultimately reduces EBIT. Each individual driver is automatically recalculated and changed in the process.
- Thanks to color highlighting, the corresponding changes are immediately recognizable and can be easily interpreted.
3. the value factor tree as a value-added factor
Constant overview
The value factor tree provides a clear overview of all relevant key figures at all times.
Full control plus maximum flexibility
In addition, you can create, run and modify scenarios as you wish to determine a wide variety of influences on your key figures (e.g. on EBIT). Full control plus maximum flexibility - for more added value!
4. contact: know more?
Would you like to delve deeper into this topic? If so, we would be happy to present all the benefits of the value factor tree to you in person - very much in combination with details on other functions of the SAP Analytics Cloud. Simply get in touch with us!

Published by:
Dr. Eric Trumm
Head of data science and innovation
Dr. Eric Trumm
How did you like the article?
How helpful was this post?
Click on a star to rate!
Average rating 4.4 / 5.
Number of ratings: 7
No votes so far! Be the first person to rate this post!


